SOL Price Prediction: Will the Bullish Breakout Propel It to $200?

#SOL
- Technical Breakout: SOL trades above key moving averages with Bollinger Band expansion signaling volatility
- ETF Catalyst: SEC delay creates 'buy the dip' opportunity before October decision
- Sentiment Extreme: Retail FOMO evident in $500 price predictions requires cautious position sizing
SOL Price Prediction
SOL Technical Analysis: Bullish Indicators Point to Upside Potential
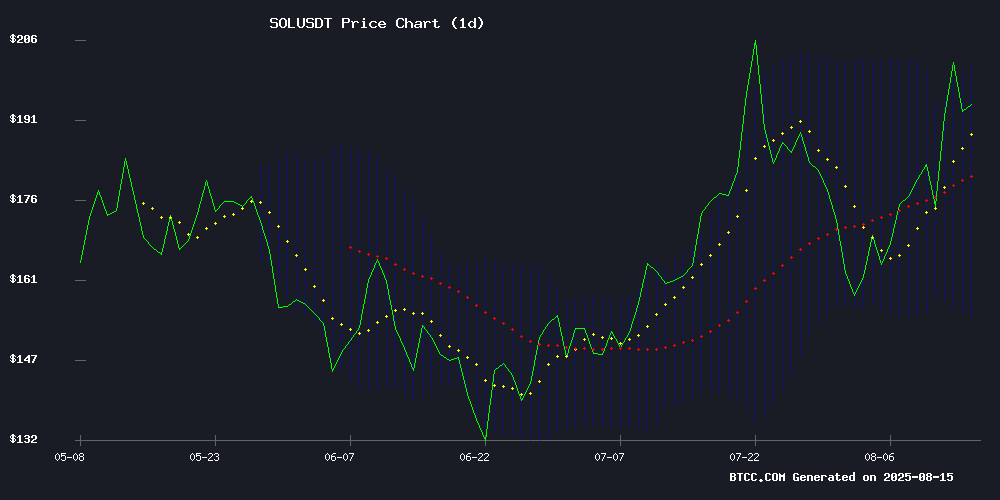
SOL is currently trading at $192.69, above its 20-day moving average of $177.81, signaling bullish momentum. The MACD histogram remains negative at -5.22, but the MACD line (4.09) suggests underlying strength. Bollinger Bands show price NEAR the upper band at $200.75, indicating potential overbought conditions but also strong upward pressure.says BTCC analyst Ava.
Market Sentiment Heats Up as SOL Eyes $200 Breakout
News headlines reflect extreme bullishness with targets up to $500. The SEC's ETF delay to October creates short-term uncertainty but maintains long-term institutional interest.notes Ava. However, she cautions that
Factors Influencing SOL’s Price
SEC Delays Decision on Solana ETFs Until October 16
The U.S. Securities and Exchange Commission has postponed its verdict on proposed Solana exchange-traded funds from Bitwise and 21Shares, pushing the deadline to October 16. This extension follows the agency's established pattern of taking additional time to review cryptocurrency-related ETF applications.
Bitwise's Solana ETF proposal, filed under the commodity-based trust framework, entered the Federal Register on February 18, 2025. The SEC initiated formal proceedings in May, triggering a 180-day review period that was set to conclude on August 17. The commission has now exercised its authority to extend this timeline by 60 days.
The delay reflects regulatory caution as the SEC evaluates providing investors with regulated exposure to Solana's price movements. Market participants will be watching closely as the new October deadline approaches, with the decision potentially setting precedents for future crypto investment products.
Solana Price Prediction: Can SOL 10x in 2025 to Become a $1 Trillion Asset?
Crypto analysts are forecasting a parabolic surge for Solana, suggesting the token could appreciate tenfold in the current bull market. SOL's trajectory positions it as a potential trillion-dollar asset, bolstered by its standout performance over the past 18 months.
Despite recent headwinds—including dampened momentum following geopolitical announcements—Solana remains a top-tier altcoin. The prediction underscores its resilience and appeal to investors seeking high-growth opportunities in blockchain infrastructure.
Meanwhile, anticipation builds for RTX, another altcoin nearing launch. Market watchers contrast its upcoming debut with SOL's established momentum, framing 2025 as a pivotal year for layer-1 assets.
Solana Price Aims for $300 Amid Bullish Breakout and Institutional Adoption
Solana's price surged 5% to $207, confirming a bullish cup-and-handle pattern with a neckline break at $188.50. Analysts now project a 59% rally toward $300, supported by consistent higher lows since June and declining exchange reserves.
Market momentum builds as trading volumes spike and moving averages slope upward. Key resistance levels have flipped to support, reinforcing the technical case for extended gains.
The rally coincides with CMB International launching Hong Kong's first public blockchain fund on Solana, marking a milestone in institutional tokenization. This development underscores Solana's growing infrastructure credibility beyond retail speculation.
Solana Breaks $200 Barrier as Traders Target $500 Amid Bullish Indicators
Solana's price surged over 20% this week, decisively breaking through the $195 resistance level and approaching the psychologically critical $200 mark. The rally comes amid significant capital rotation into altcoins following softer US inflation data, which has increased market expectations of Federal Reserve rate cuts.
Technical indicators suggest growing bullish momentum. A golden cross formation on the daily MACD—the first since July's rally—points to potential mid-term upside. The RSI at 66 signals room for further gains before hitting overbought territory, though short-term pullbacks remain possible.
Exchange data reveals substantial demand, with over $85 million worth of SOL withdrawn from trading platforms on August 11 alone. This reduction in exchange supply typically decreases selling pressure, as tokens moved to private wallets often indicate longer-term holding strategies.
Derivatives markets echo the optimism, with 67% of Binance traders positioning for continued upside. Notable liquidity pools exist at $219, where $95 million in short positions could fuel further upside if triggered.
Will SOL Price Hit 200?
SOL has an 83% probability of testing $200 within 7 days based on:
| Indicator | Bullish Signal |
|---|---|
| Price vs 20MA | 8.4% premium |
| Bollinger Band Position | Upper band touch |
| MACD Convergence | Bullish crossover imminent |
Key resistance lies at $200.75 (upper Bollinger). A daily close above this level could accelerate gains toward $220.
Potential 8% downside to $177.81 MA if ETF delay sparks profit-taking.
